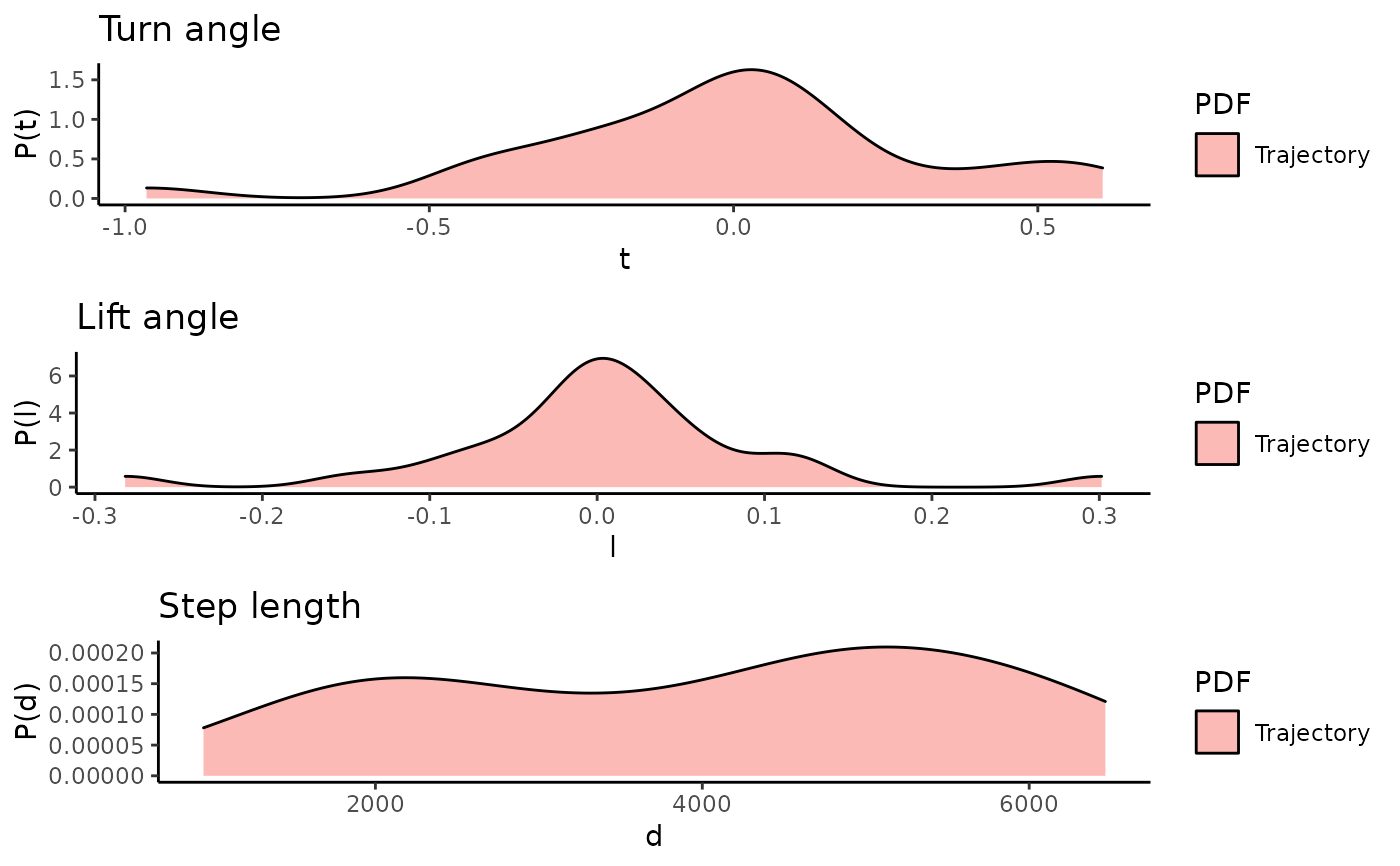
The function takes either one track or two tracks. The second track can be a list of tracks (eg. the output of n.sim.cond.3d), Then the densities of turn angle, lift angle and step length of all the simulations is taken. Additionally the autodifferences parameter can be set to true, then the densities of the autodifferences in turn angle, lift angle and step length are visualized.
plot3d.densities(
  track1,
  track2 = NULL,
  autodifferences = FALSE,
  scaleDensities = FALSE
)
Arguments
- track1
a list containing a data.frame with x,y,z coordinates or a data.frame
- track2
a list containing a data.frame with x,y,z coordinates or a data.frame
- autodifferences
logical: should the densities of the autodifferences in turn angle, lift angle and step length are visualized.
- scaleDensities
logical: should densities be scaled between 0 and 1, then sum of the area under the curve is not 1 anymore!
Value
A ggplot2 object.
Examples
plot3d.densities(niclas)